disk | |
 |
 |
 |
 |
 |
 |
 |
 |
 |
 |
 |
 |
 |
 |
 |
 |
 |
 |
 |
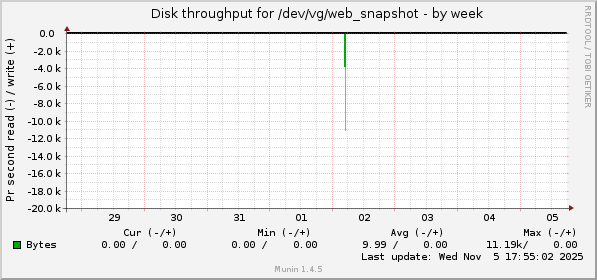 |
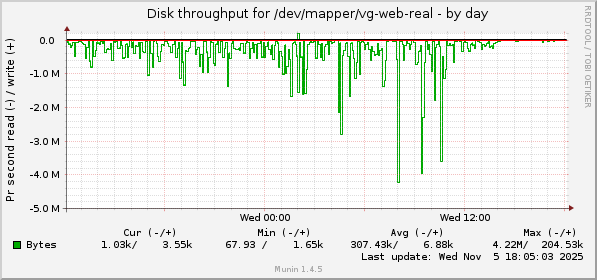
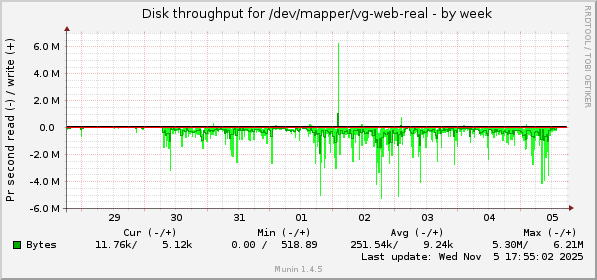
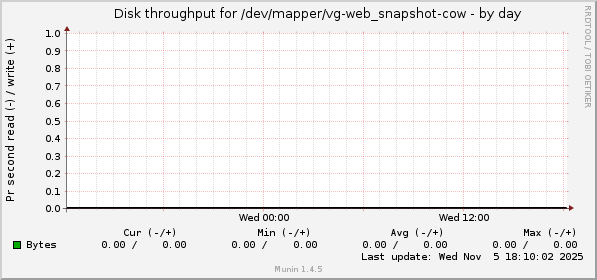
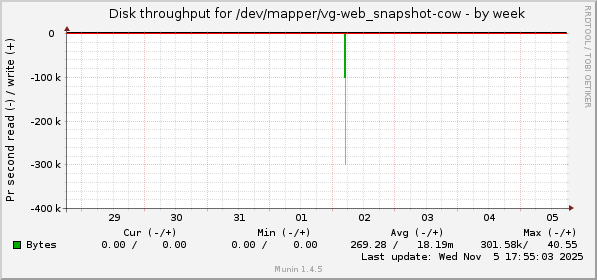
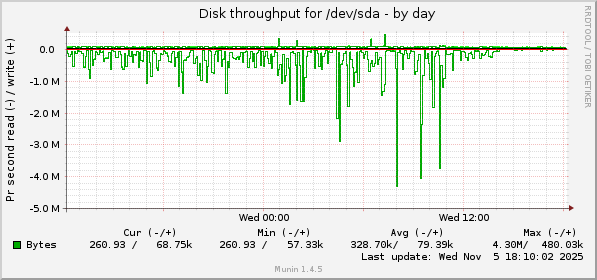
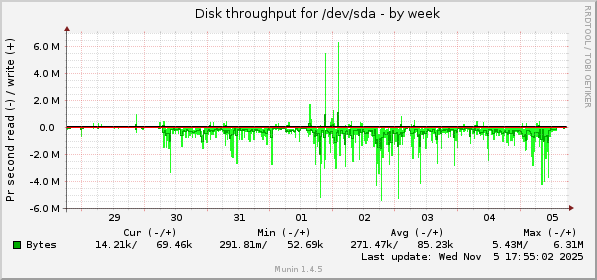
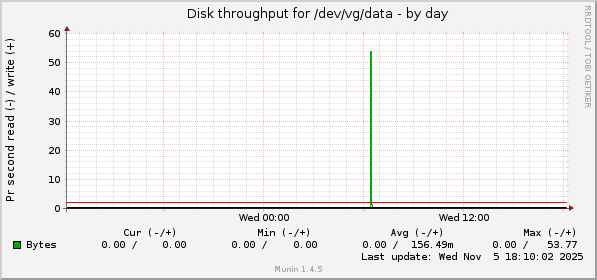
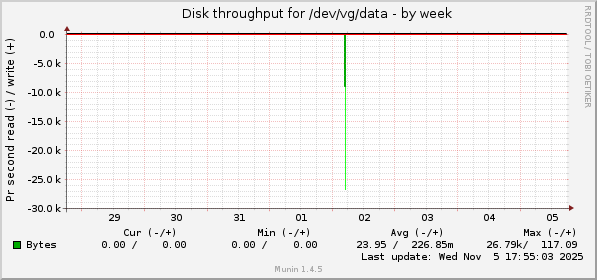
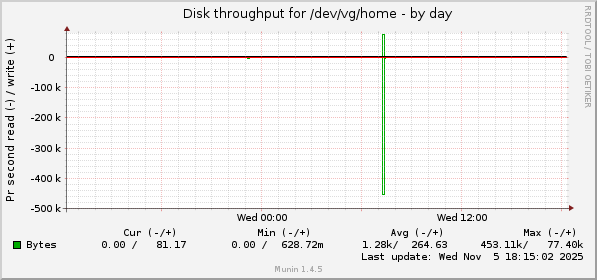
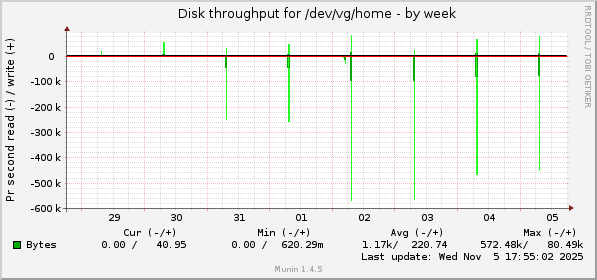
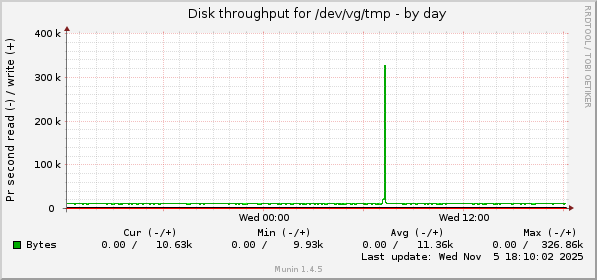
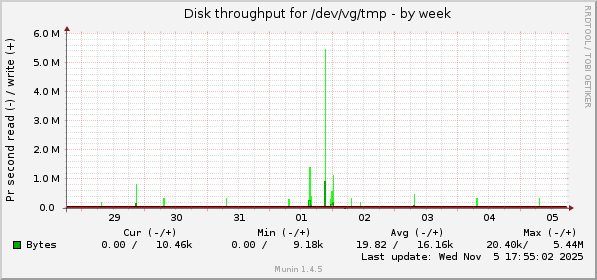
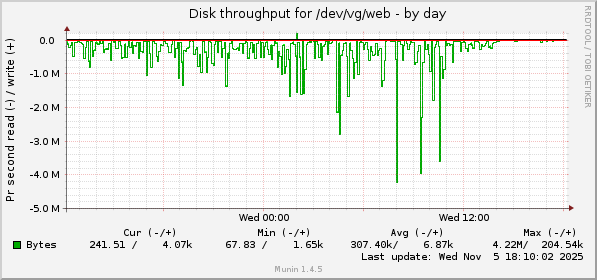
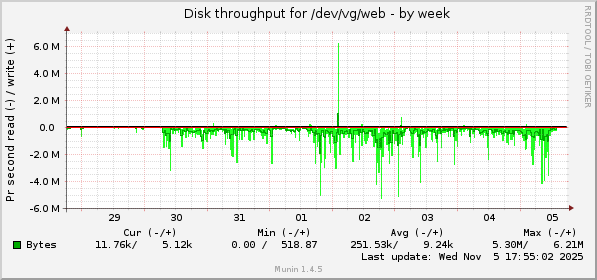
Overview :: SD :: clara-oswald.rbx4.optitech.fr :: diskstats_throughput |
|
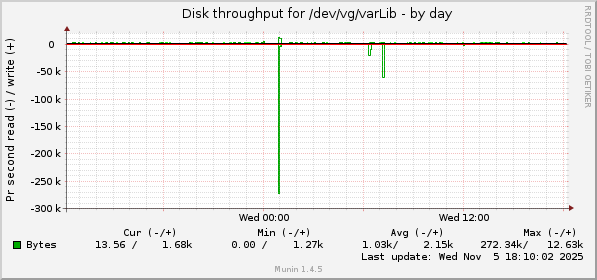
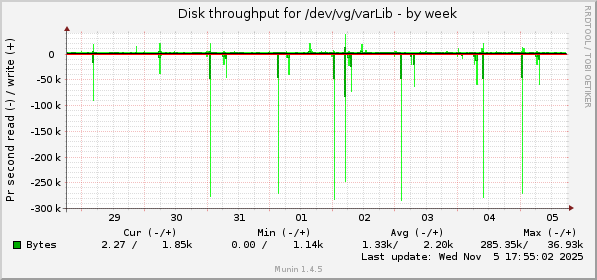
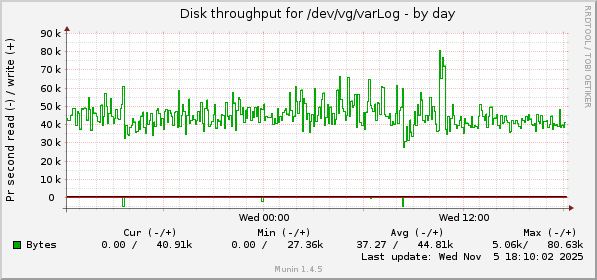
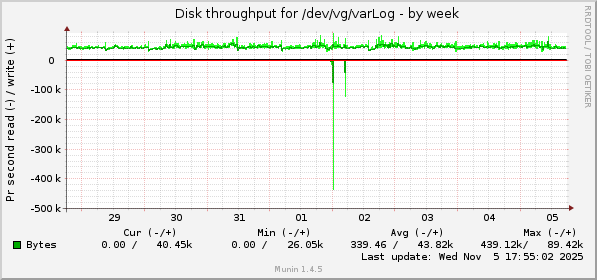
diskstats_throughput :: [ disk ] |
| ||||||||||||||||||||||||||||||||
| Overview :: SD :: clara-oswald.rbx4.optitech.fr :: | ||||||||||||||||||||||||||||||||
| This page was generated by Munin version 1.4.5 at 2026-06-09 19:40:43+0200 (CEST) |